Flow/Log Alerts
Alerts Page
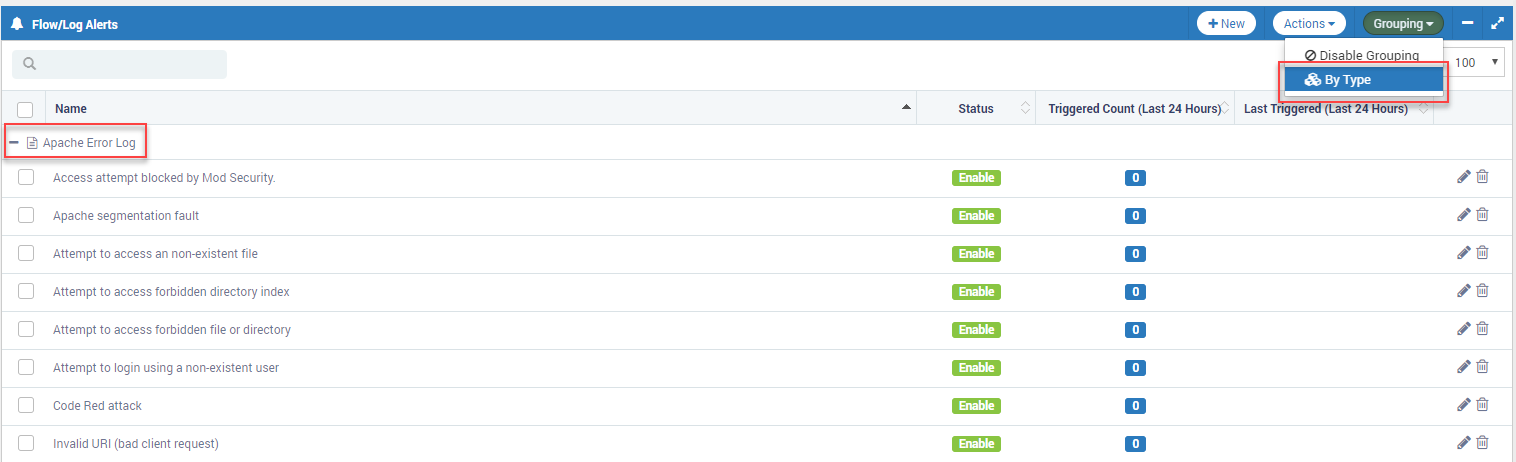
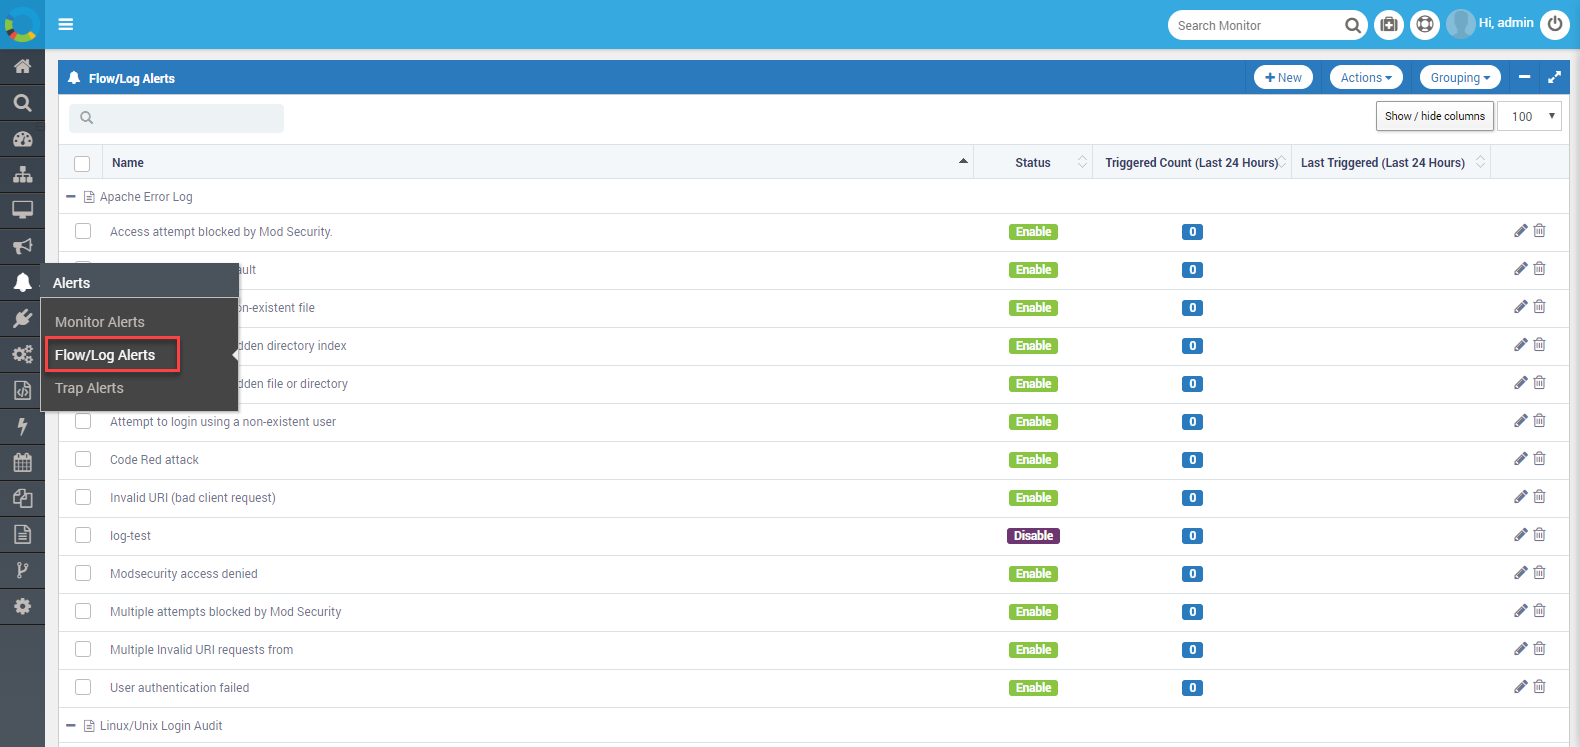
The page displays all the alerts related to flows and logs. The list is grouped based on the source and pre-configured alerts are displayed by default. The list is by default formatted in alphabetical order and shows following information:
Flow/Log Alerts
Name: Name of the flow/log alert
Status: Status of the alert for the log/flow
Triggered Count (Last 24 hours): Number of times the alert was generated by system in last 24 hours.
Last Triggered (Last 24 hours): Column shows the last time when the trigger was fired.
Show/Hide Columns: To show or hide the columns of the alert screen, click on the ‘Show/Hide Columns’. The columns in the list are:
Type: Shows the information about ‘monitor type’ for which alert is generated.
Severity: Shows the information about the severity status of the alert.
Historical Trend: Shows the bar graph with total 24 bars for last 24 hours. Each bar shows the number of times the alert was generated in a given hour.
Pagination
Change the number of alerts you are seeing on the page. By default the page size is 10. You can set page size as 20, 50, 75 or 100.
Actions on Alerts
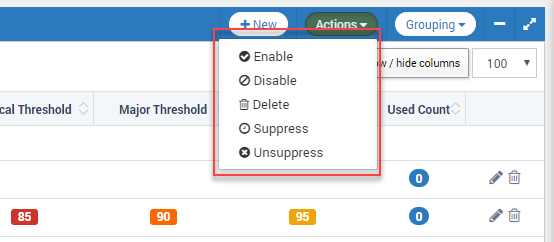
Actions Available for Alerts
Enable |
Enables the alert. Motadata will evaluate the conditions and actions of the alert and compare with the monitors. |
Disable |
Disables the alert. Motadata will ignore the conditions and actions of the alert. |
Delete |
Deletes the alert. It removes the alert from the system. This is an irreversible action. |
Suppress |
Suppress the notifications for the alert. |
Unsuppress |
Notifies you when the alert is triggered. |